
Analysis of Peel Region’s Real Estate Market Conditions
Yes, the GTA market crashed!
It is obvious to everyone residing in GTA, that local real estate market had taken a major dive. However most of the people don’t know the status of the current market until it is announced on the news, usually weeks or months later. Since I am based in Mississauga and regularly buy and sell properties for my clients in Peel Region (and rest of GTA), I have taken some of Toronto Real Estate Board supplied, most recent charts, with market statistics and done a basic Technical analysis in an effort to demystify the current market situation in Peel Region’s real estate markets. Below is a brief analysis of all combined markets (detached, semi, town, condo etc).
Sales have taken a beating!
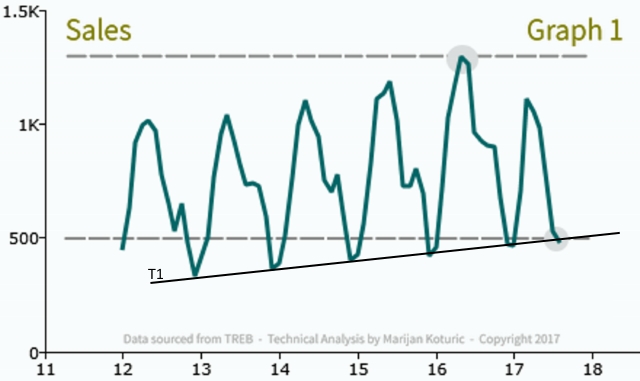
As Graph 1 demonstrates, current sales level has dramatically fallen at nearly 1/3 of the 2016 level. What is interesting to note is that the chart shows the current level testing a strong trend line/support level which it must break in order for sales to plummet further down (lets hope the support holds!). More alarming is that the current sales levels are already at those low levels that traditionally occur at the very end of the year, for the past 5 years.
Average Prices are Waaaay Down
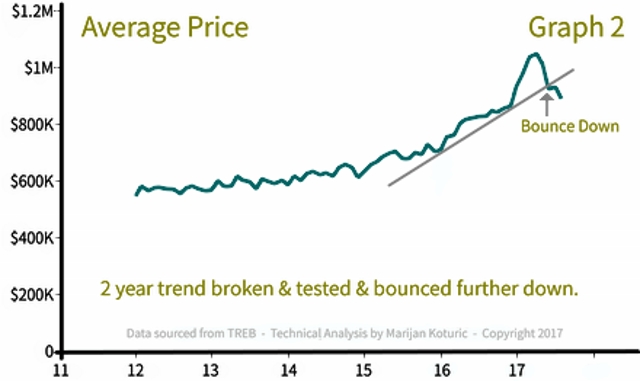
Average Price graph points to a grim picture of the market. Not only did the price break a major trend line/support level, right after that it attempted to cross back above the trend line, however, instead of a positive move, it rebounded back further down. If the average price breaks the $800k level, we may be in for a long haul.
Twice as many homes for sale in Peel Region
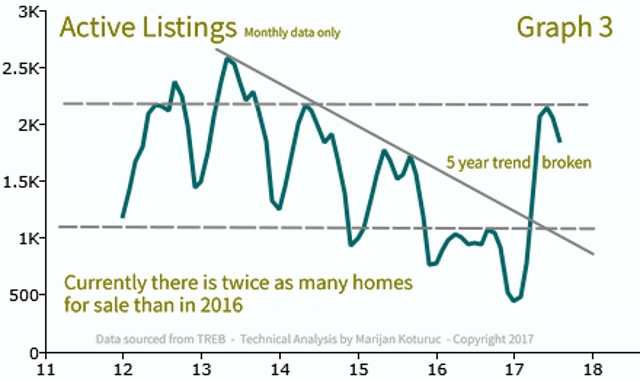
As the Graph 3 shows, there are now twice as many homes for sale now as they were at the peak of 2016. The current number of listings has also broken a 4-year trend and more importantly it has done so during the spring/summer season, coinciding with Kathleen Wynn’s Ontario government’s announcement of measures that were designed to cool the market. Those measures appear to have worked very well!!! So if you have bought a home at the beginning of the year or just before the announcement you are now likely suffering 30-40% loss in a value of your property.
Gets worse!
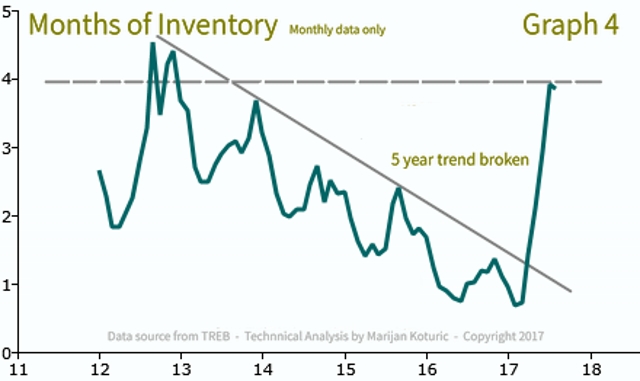
To make things worse, along with doubled number of active listings, the length of time it takes to sell a property is increased now to 2013 levels!!! We are now sitting at inventory that takes nearly 3 times as long to sell than what it took at peak (read: worst) levels in 2016 (the chart indicates that it would take 4 months to sell out current inventory at the current absorption levels). Further to this, the levels have broken the very important 5-year trend line without any hesitation. In my experience, for an ideal market we should be in a 2-month inventory range. A bit of good news, as of last couple of weeks, I have noticed a slight drop in the number of homes for sale, due to the sellers taking their properties off the market and waiting for better days (not recorded here since TREB’s charts are not real time).
Homes taking forever to sell!
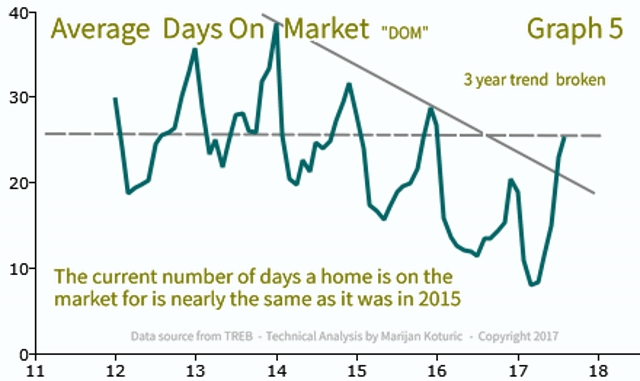
Remember when homes used to sell in a day? How about in an hour? How about before they were even listed? That was just earlier this year! The average time the homes stay on the market in Mississauga/Peel region is now near 2015 levels, taking just over 25 days on average to sell a property. Again, the important 3-year trend line was broken without hesitation. This certainly does not help clearing out the current inventory.
A ray of hope for those looking to recover some of those lost gains.
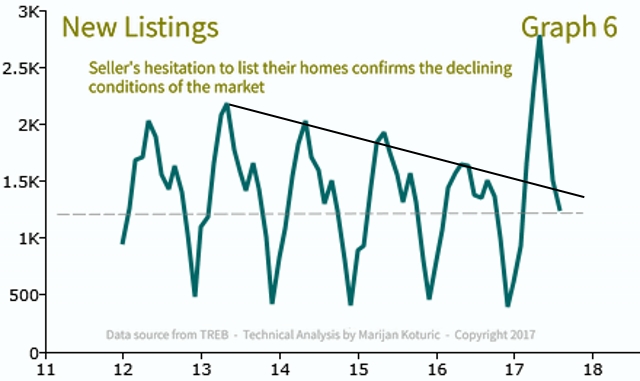
Although the above graph shows a reduction in the number of new listings and confirms the declining conditions in the market, it was the number of listings that doubled nearly over night that caused the price crash in the first place, so a healthy reduction in new listings is bound to bring us back a healthier balance between sellers and buyers and thus pushing those home values a bit higher.
For those people considering buying a home, this seems like a good opportunity to capitalize on some of the downturn in the home prices, (make sure you are familiar with the areas of strongest declines and best opportunity for future growth before you jump).
Condos appear to defy the current market trends, read detailed analysis here
If you are in the market and you need a real, proven, award winning expert, to help you buy or sell your home then call, text or message me to get started.
Marijan Koturic, Real Estate Broker
Orion Realty Corporation, Brokerage
647-892-5007
Disclaimer: Above charts are generated by Toronto Real Estate Board. The technical analysis provided above is for informational purposes only and it is not an investment or buy/sell advice and it is not indicative of future real estate market performance.